Variables
In a ProModel simulation, Variables are Real or Integer type global numerical values used to track statistics throughout the system. Variables can store information that can be used during the simulation or the output results, and they can also be displayed on the layout during the simulation. Variables are often used for counting throughput, making decisions, tracking Work In Progress, calculating custom statistics, or displaying other data during simulation.
To access information about the Variables in your model, open the Model Elements panel and navigate to the Variables tab.
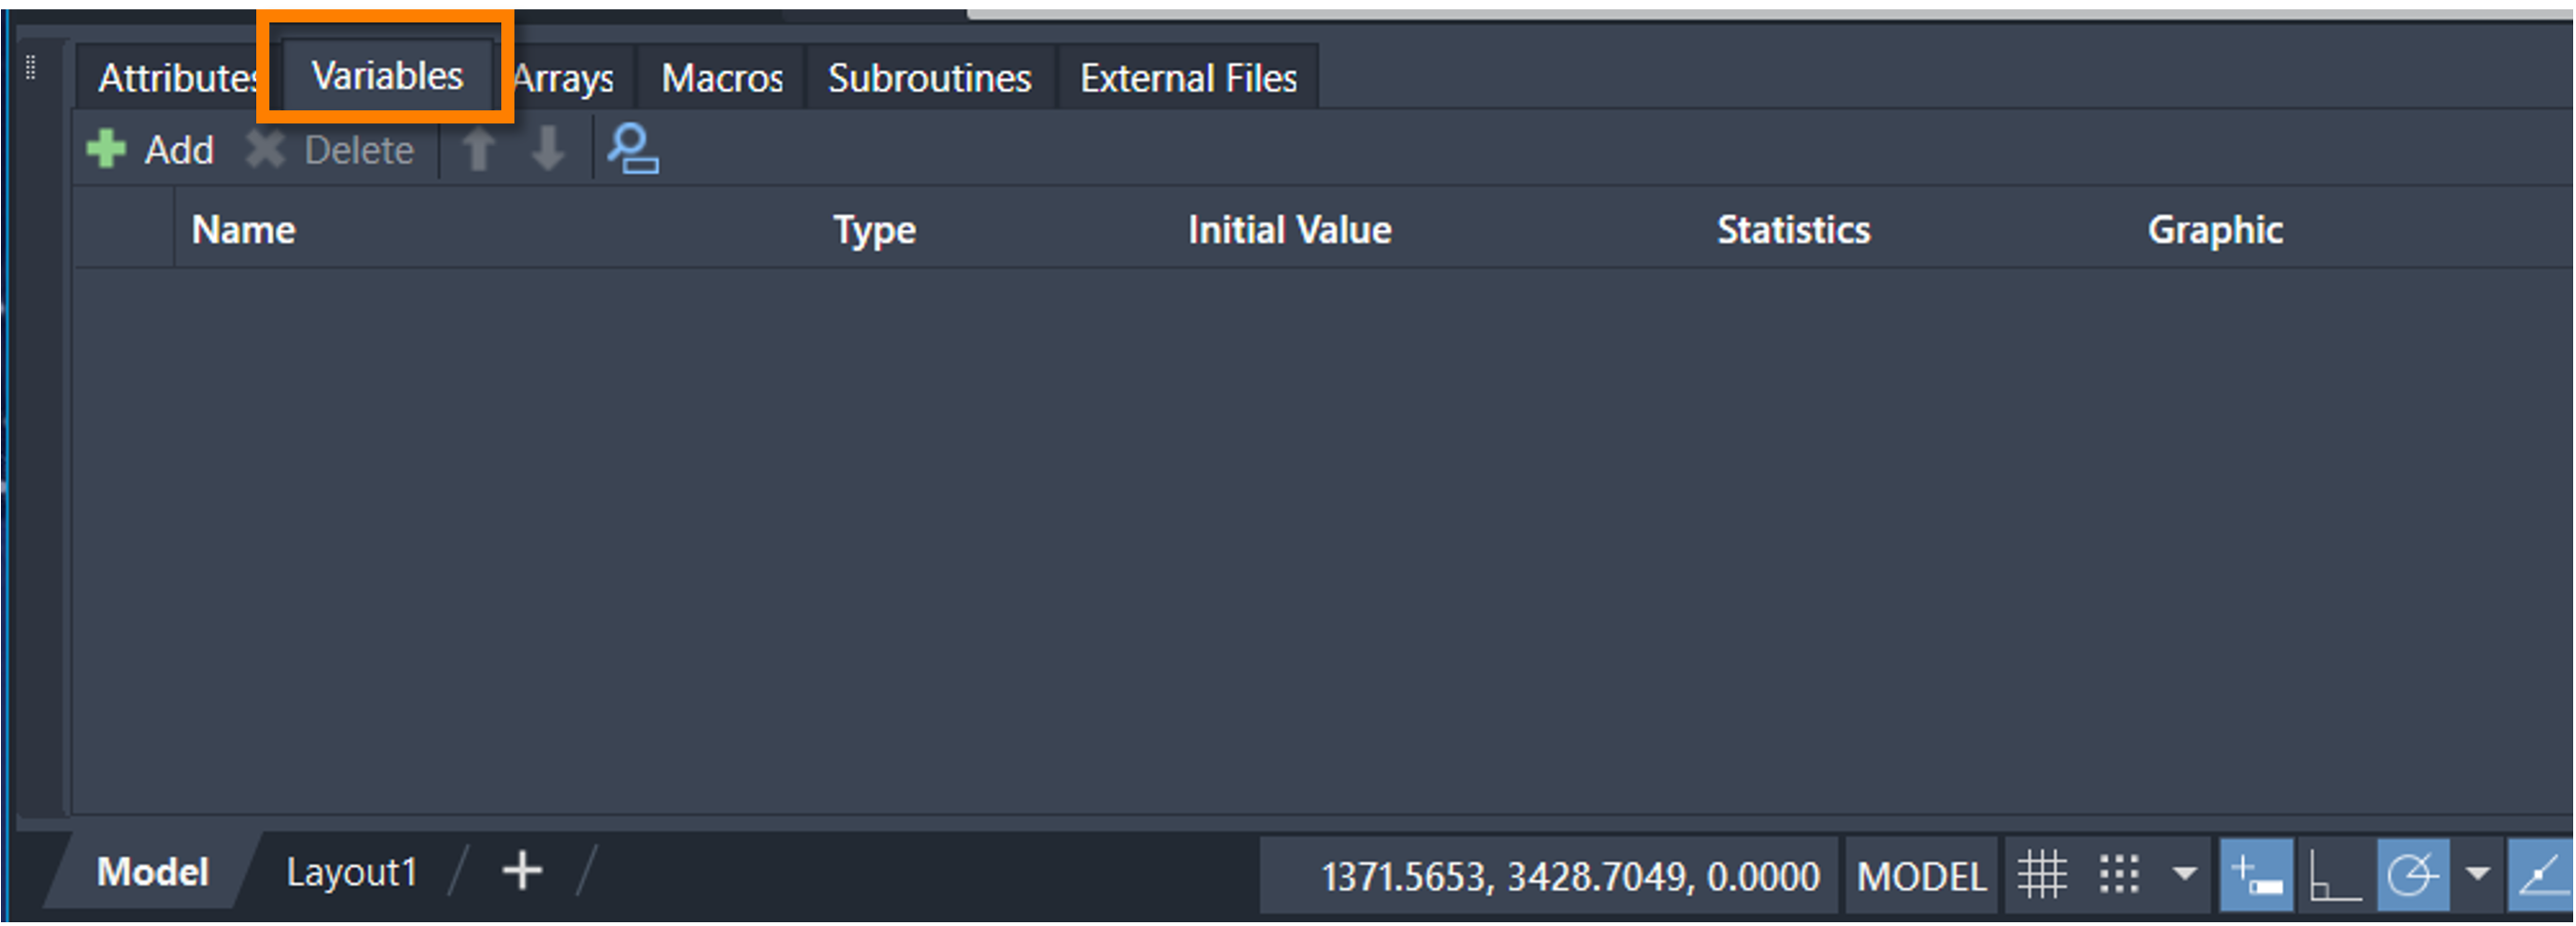
To add a Variable to your model, select Add on the Model Elements panel. Selecting Add creates a Variable with the name Var1, the type Integer, an initial 0 value, with the Time Weighted Statistics option selected, and with the Graphic box cleared.
To change a Variable name, double-click the Name column box.
To change a Variable type, select a type from the menu that appears when you double-click a Type column box.
To assign an initial value to your Variable, edit the Initial Value column box. If your Variable type is Integer, ProModel only accept integers in this field. Both positive and negative numbers are acceptable.
To change the type of statistical information that is collected for a Variable, double-click the Statistic column box to see a menu of the statistical information types. Time Weighted Statistics collect information on the percentage of time the Variable is at a specific value (for its average value). Observation Statistics collect information on the number of times the Variable changed to a specific value (for its average value). You may also select None to collect no statistical information for this Variable.
To add a graphic to the layout that displays the value of a particular Variable, check the Graphic box.
To delete a Variable from your model, select a Variable and select the keyboard Delete.
To reorder your Variables within the Model Elements panel, select a Variable and use the blue arrows ![]() .
.
To search for a specific Variable within your model, select the search icon ![]() .
With the search panel open, type a Variable name.
.
With the search panel open, type a Variable name.
To change the value of a Variable at a certain Location within the system:
- With the Simulation Properties panel open, go to the Simulation Browser's Flow tab.
- Go to the Location in the Simulation Browser.
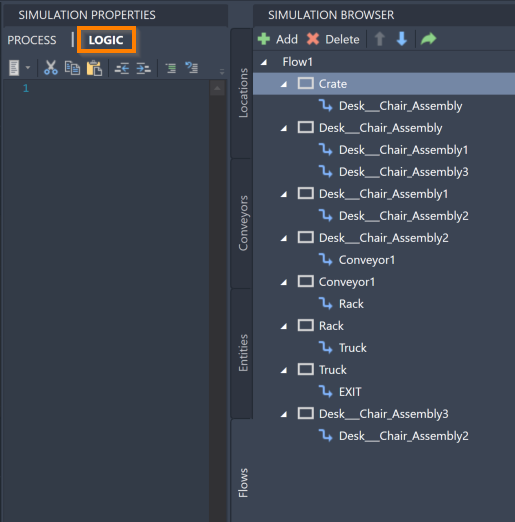
- On the Simulation Properties panel, select Logic to view the Logic information for that Location.
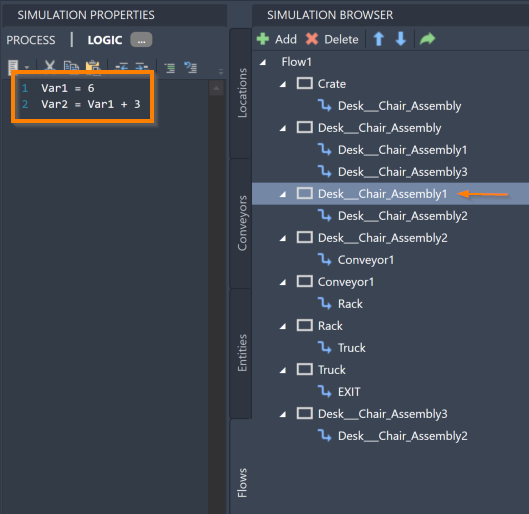
You may now use the equals sign (=) to reassign a Variable value using its name, which causes the Variable to change every time an Entity enters this Location. You may also use mathematical formulas and other Variables to determine the new Variable values.
You may also use other Logic functions to assign values to your Variables. For more information, see Logic.
To view collected Variable statistical information, you must first run a simulation. To run the simulation, select the Simulate icon in the ProModel ribbon. For more information about what options are available to you when you run your simulation, see Simulation.
![]()
After the simulation has completed, a dialog opens with the following message:

Select Yes to open Output Viewer and view the simulation results.
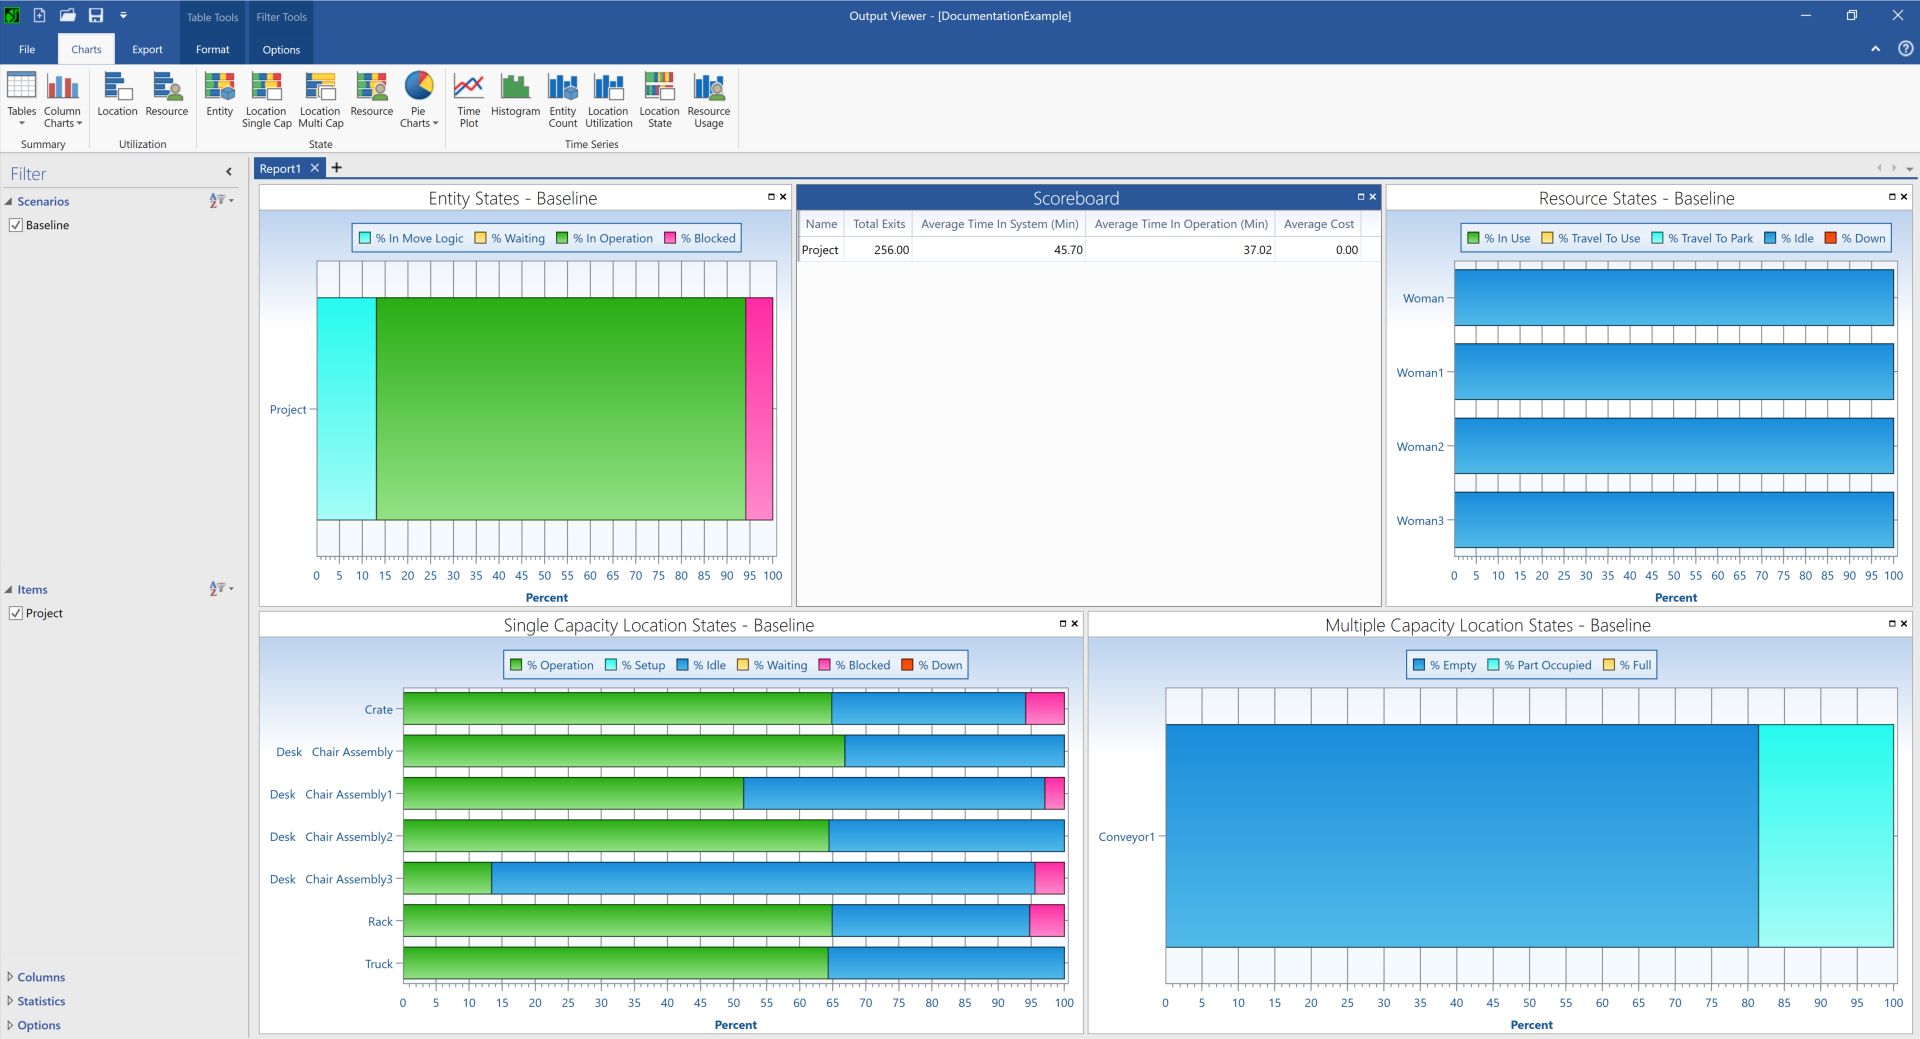
There are a few different ways to view the Variable information in Output Viewer. To see a table that displays information about your Variables:
- Select the Tables icon.
- Select the Summary icon under the Variable section to see a table that includes the following information about each of your Variables: Name, Total Changes, Average Time Per Change, Minimum Value, Maximum Value, Current Value, and Average Value.

To see a column chart where you can view and compare information about your Variables:
- Select the Column Charts icon.
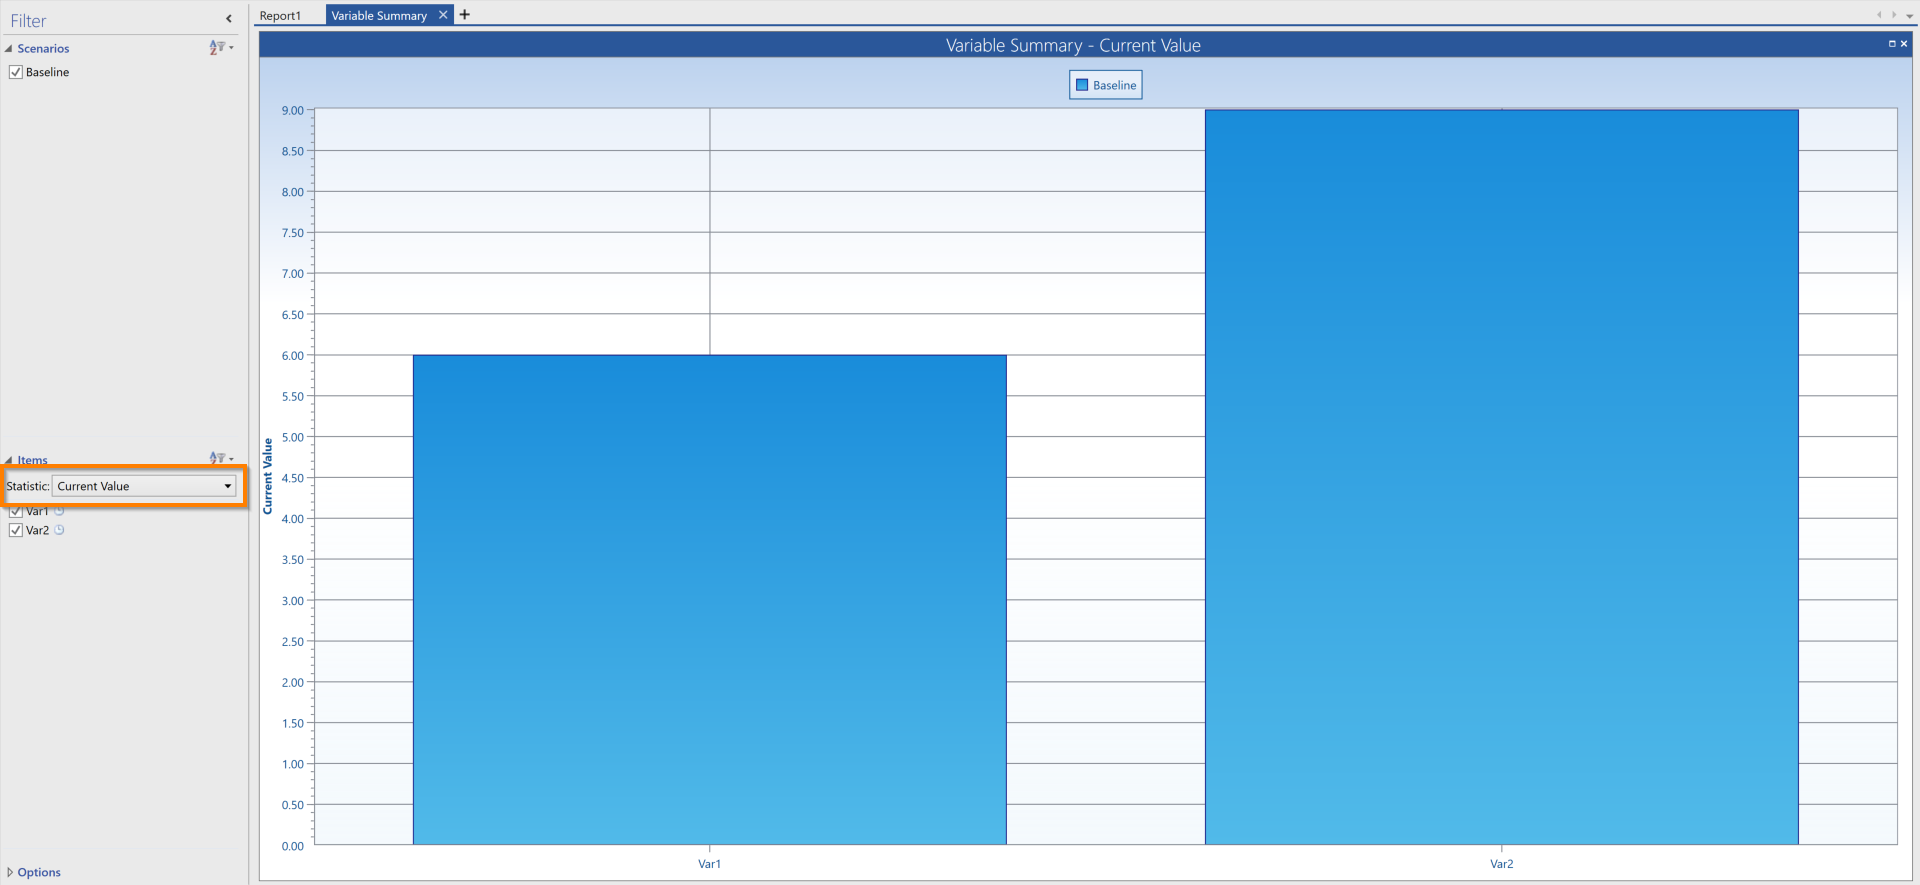
- Select the Summary icon under the Variable section to see a column chart displaying the current value of each of your Variables.
- To change the information being displayed, select the Statistic box and see a menu of possible options.
The options for displayable information in a column chart include Total Changes, Average Time Per Change, Minimum Value, Maximum Value, Current Value and Average Value.
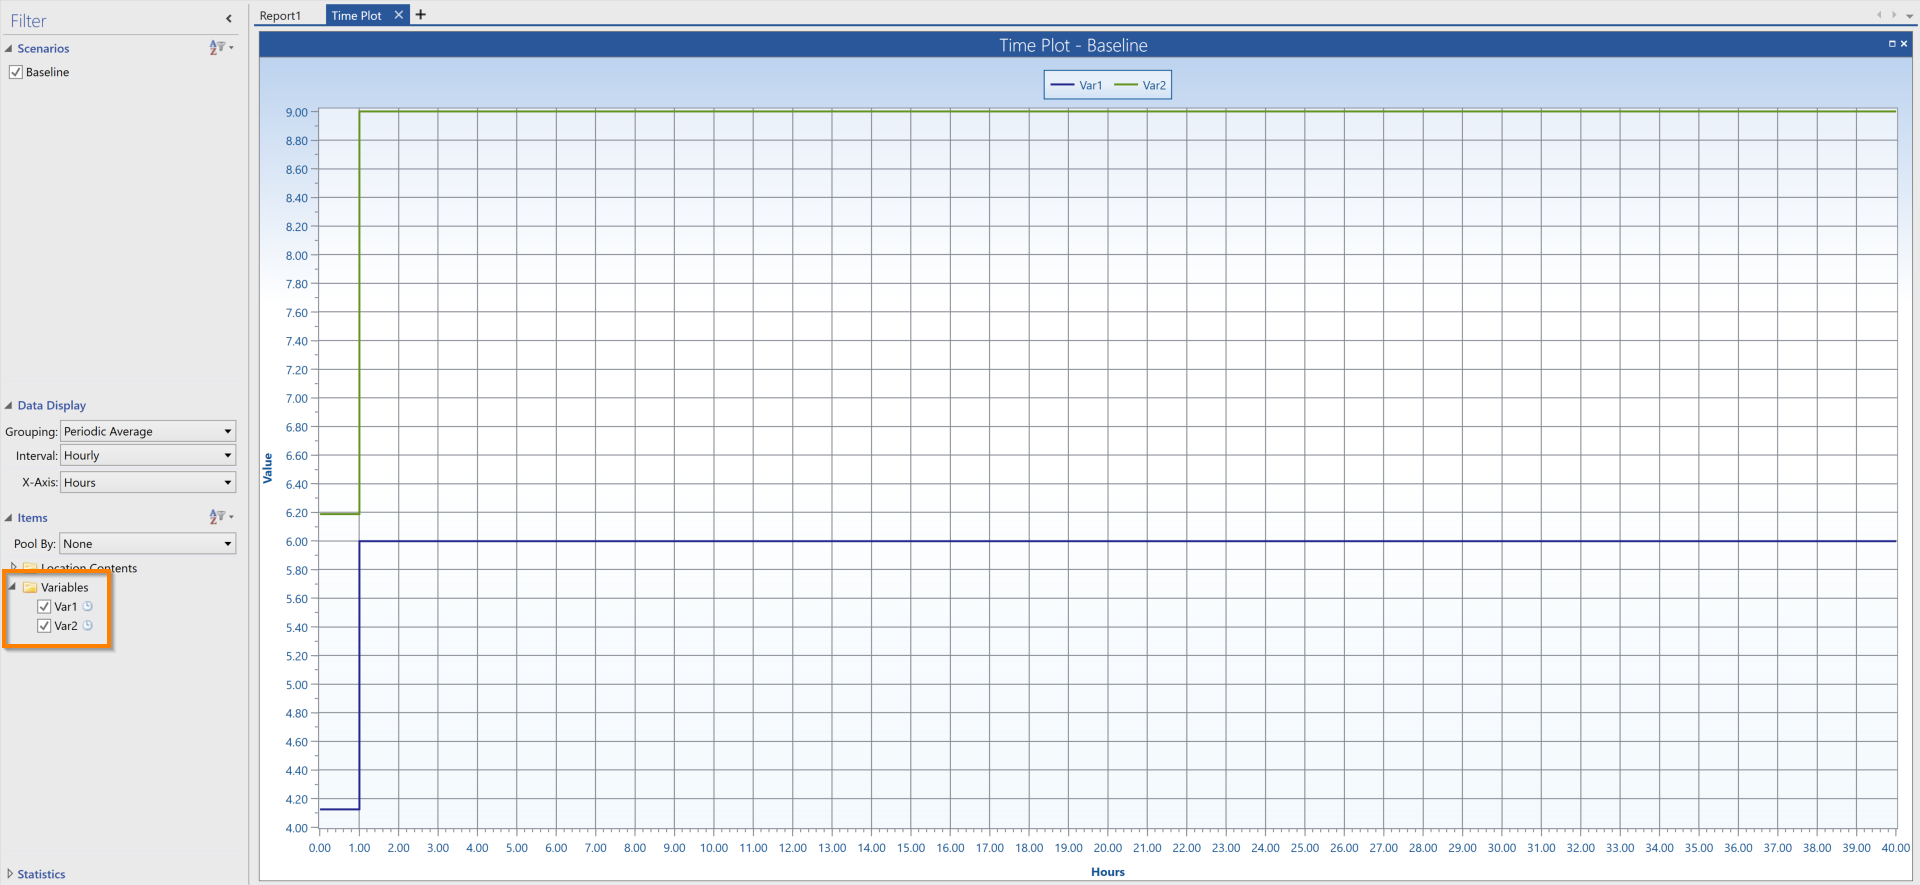
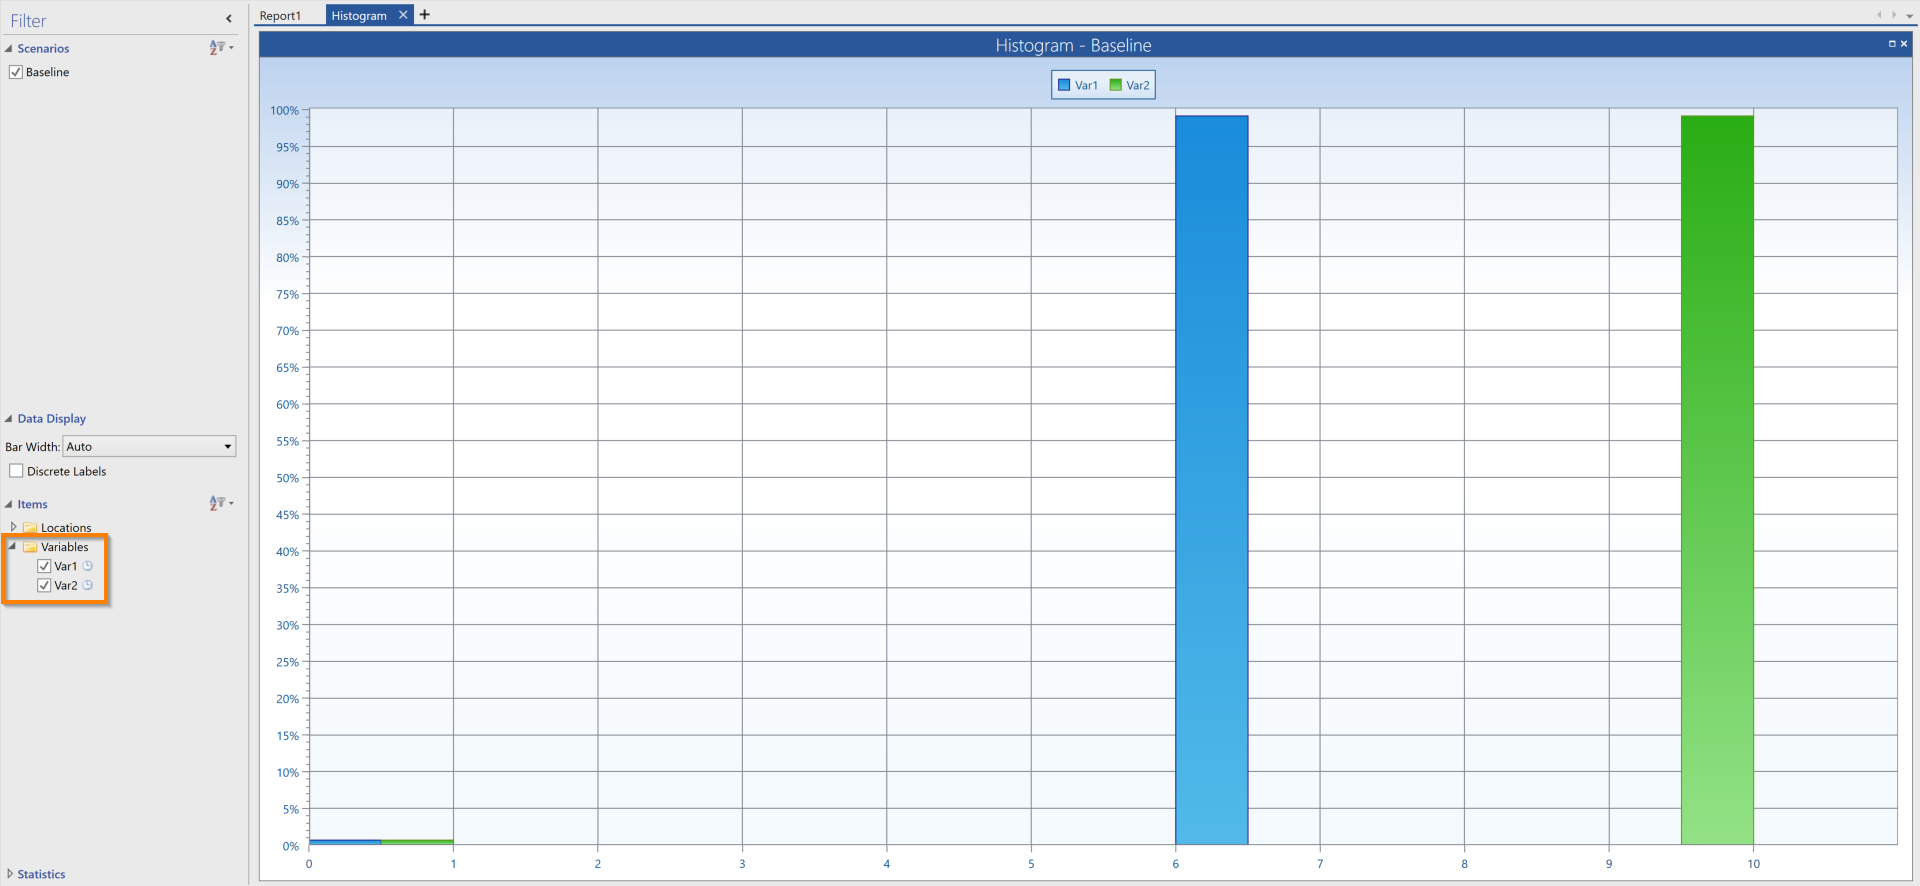
You may also add information about Variables to a time plot or histogram displaying other simulation results. While viewing a time plot or histogram, navigate to the Items list on the left hand side. Under the Variables folder, locate a list of your created Variables. Select the corresponding box to display its information on the time plot or histogram.
For more information about how to view and interpret your simulation results, see Simulation Results.