Reports
As you first open Output Viewer to view your simulation results, a report is created for you named Report1.
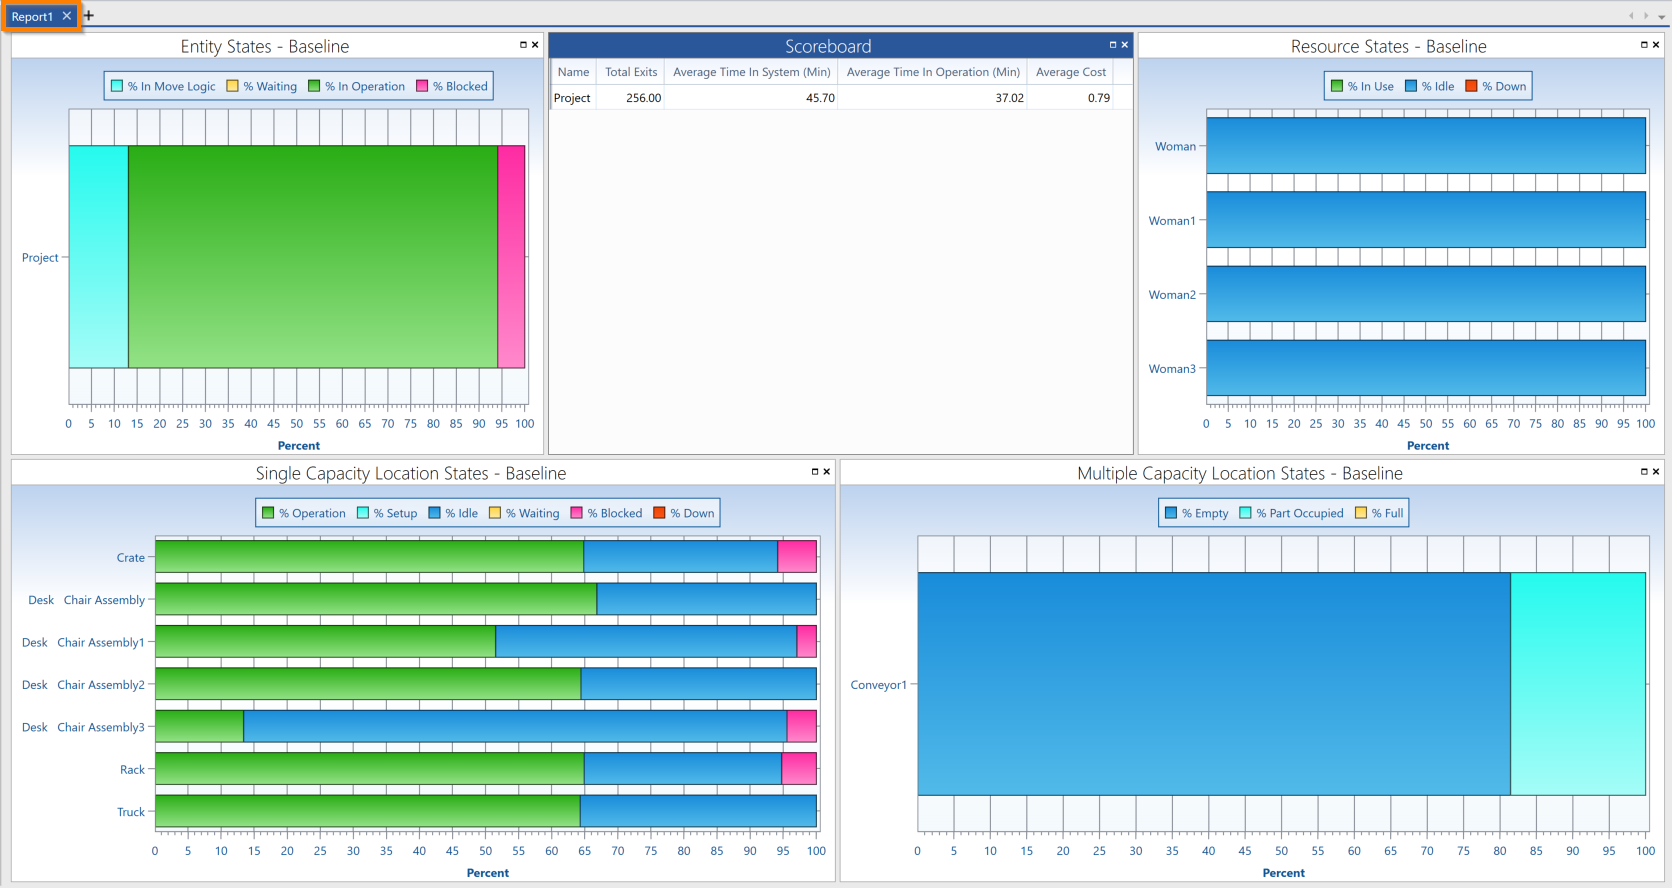
A report is a collection of tables and charts that you can create to display your desired simulation results. You may edit the initial report or create new reports to display your desired information.
To add a new report, select the add icon + above the report, table, or chart that is currently displayed.
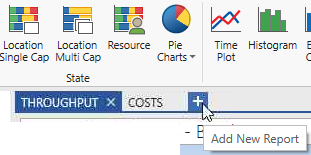
To rename a report, double-click the report name to open a new window. Type your desired report name and select OK or the keyboard Enter to confirm. You may also select Cancel to exit out of the naming process.
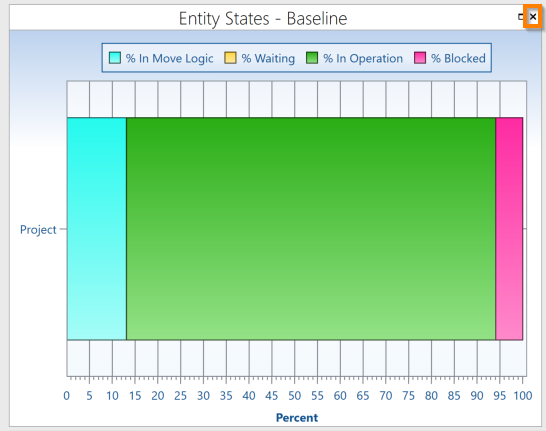
To remove a table or chart from a report, select X in the table or chart's upper-right corner.
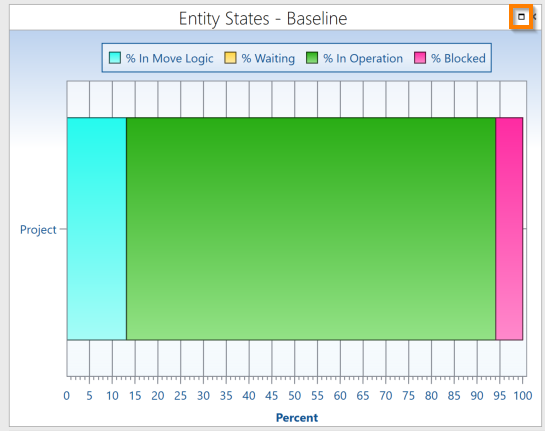
To open a table or chart full screen, select the Full Screen icon also in the table or chart's upper-right corner.
To change where a table or chart is displayed on a report, select and hold the title header to drag to another location. As you drag the graphic, arrows appear over the report to indicate different position options. Move the graphic to one of these arrows and release to drop the table or chart in the indicated area.
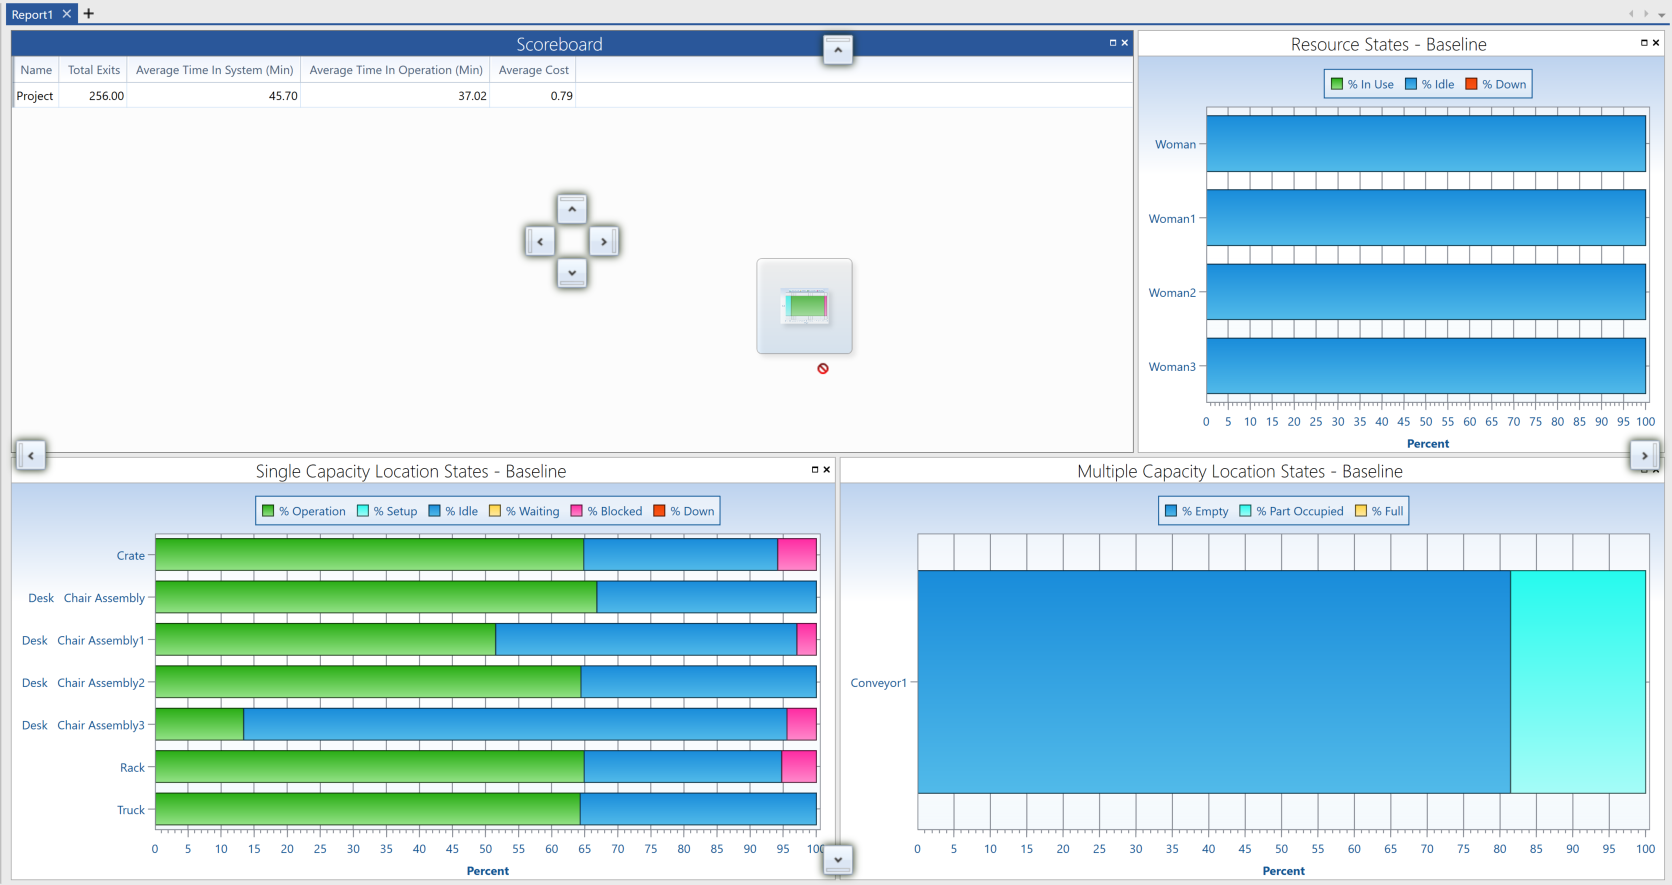
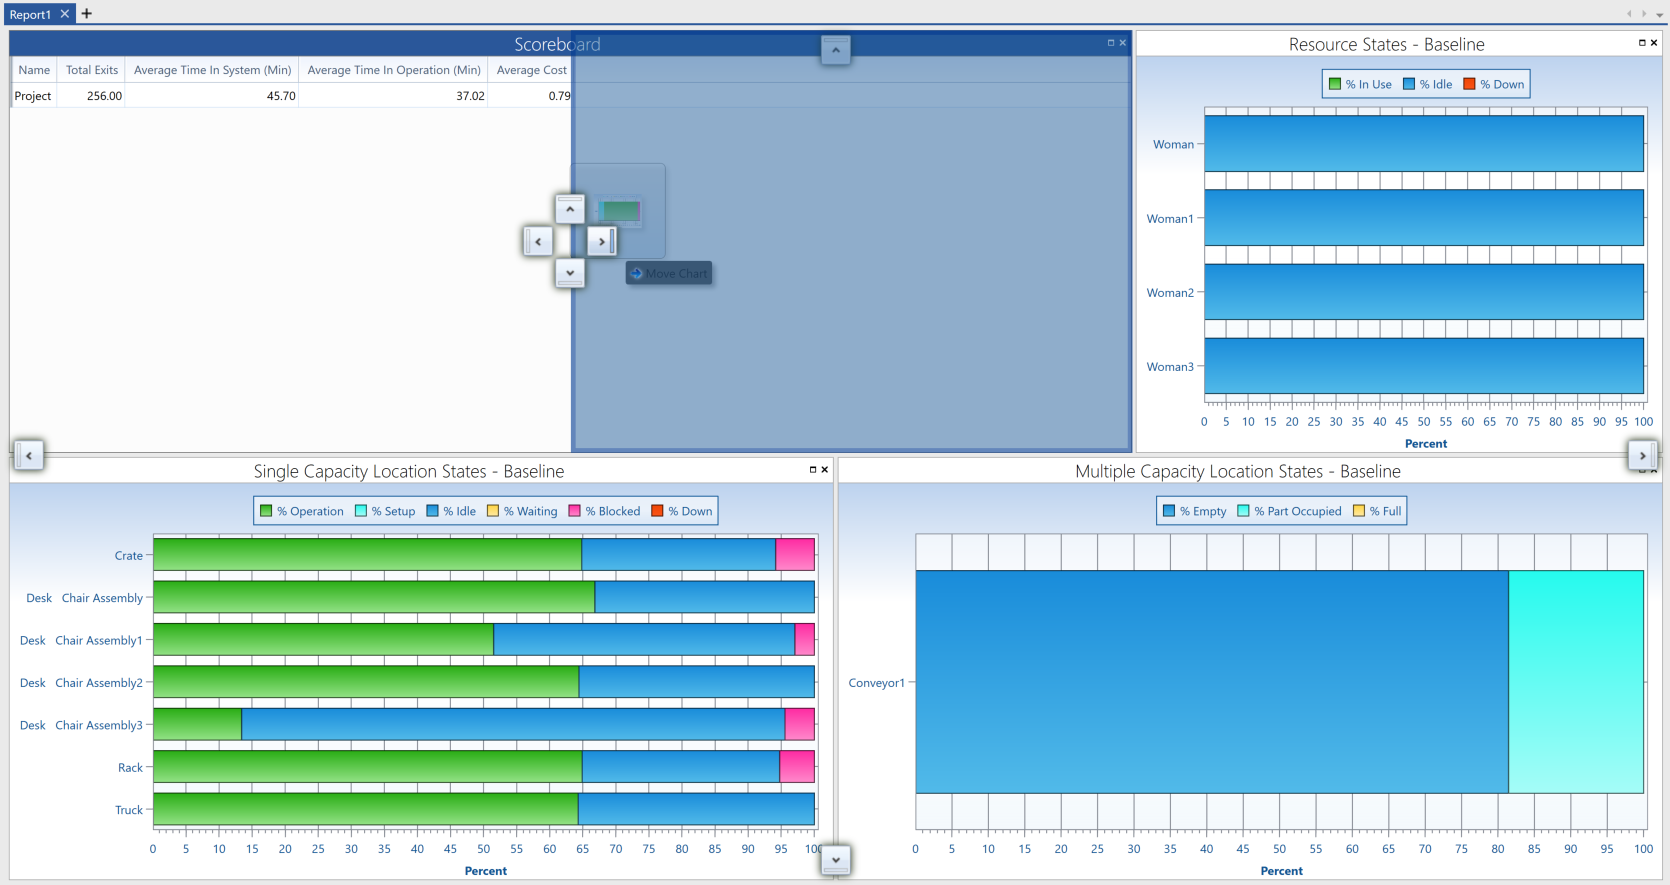
To change how large a table or chart is on a report, select and hold the edges of the table or chart and drag to resize the item.
To add a new table or chart to an existing report:
- In Output View, go to the Charts ribbon.
- Select and hold an icon to drag and position the item in the report area:
- For Charts, drag the icon from the ribbon.
- For Tables, select the Table menu to expand and drag the icon from the menu.
As you drag the graphic, arrows appear over the report to indicate different position options. Move the graphic to one of these arrows and release to drop the table or chart in the indicated area.

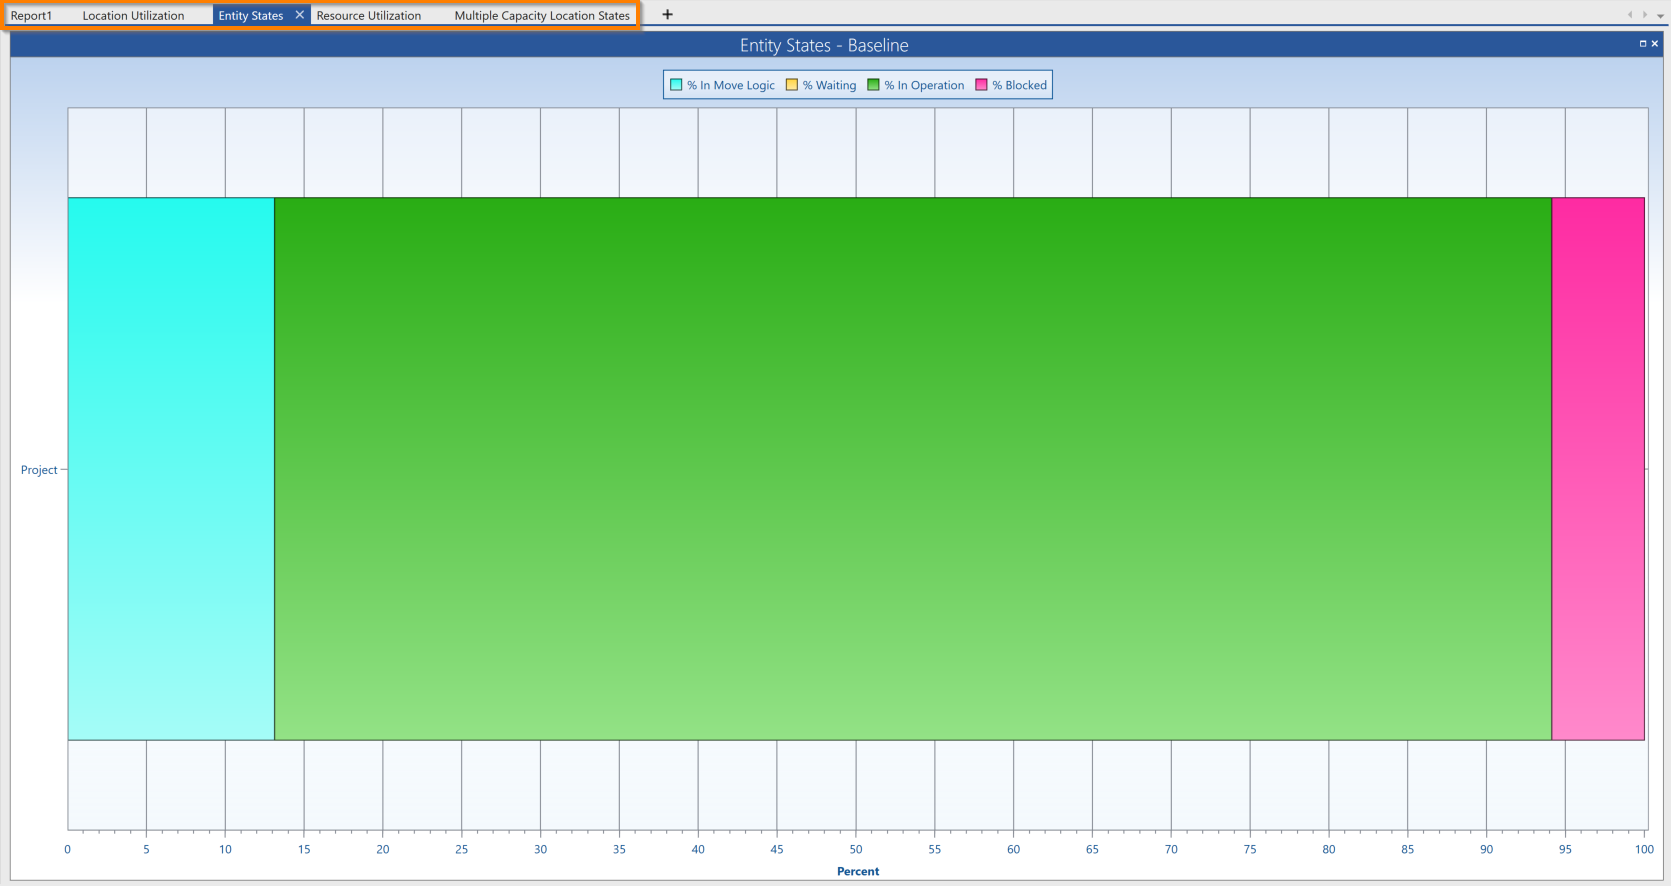
You may also select the icons and view them individually in a tab separate from any report.
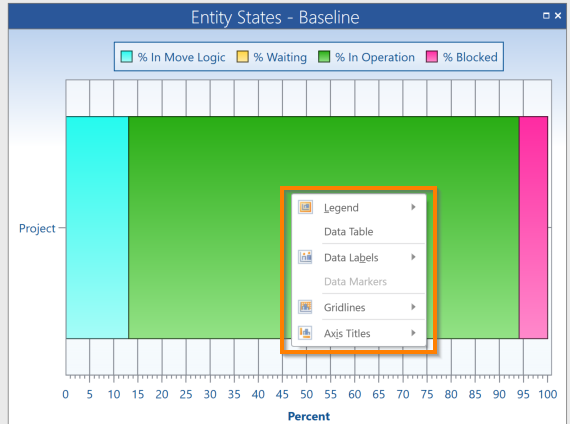
Right-click a table or chart to see text and stylistic options.
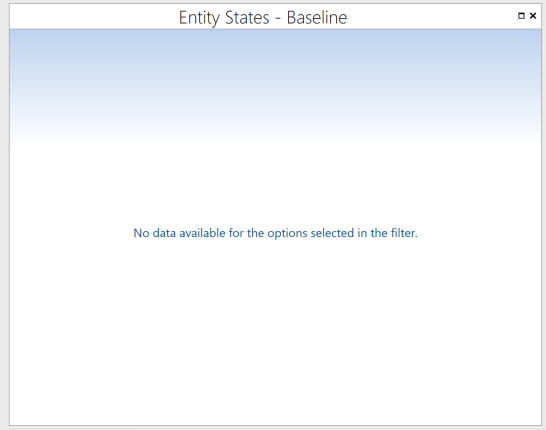
If a table or chart displays “No data available for the options selected in the filter”, this message either means that the necessary components for the table or chart do not exist in the model, or that they have been deselected in the Output Viewer Filter.
The Output Viewer Filter panel is located on the report's left.
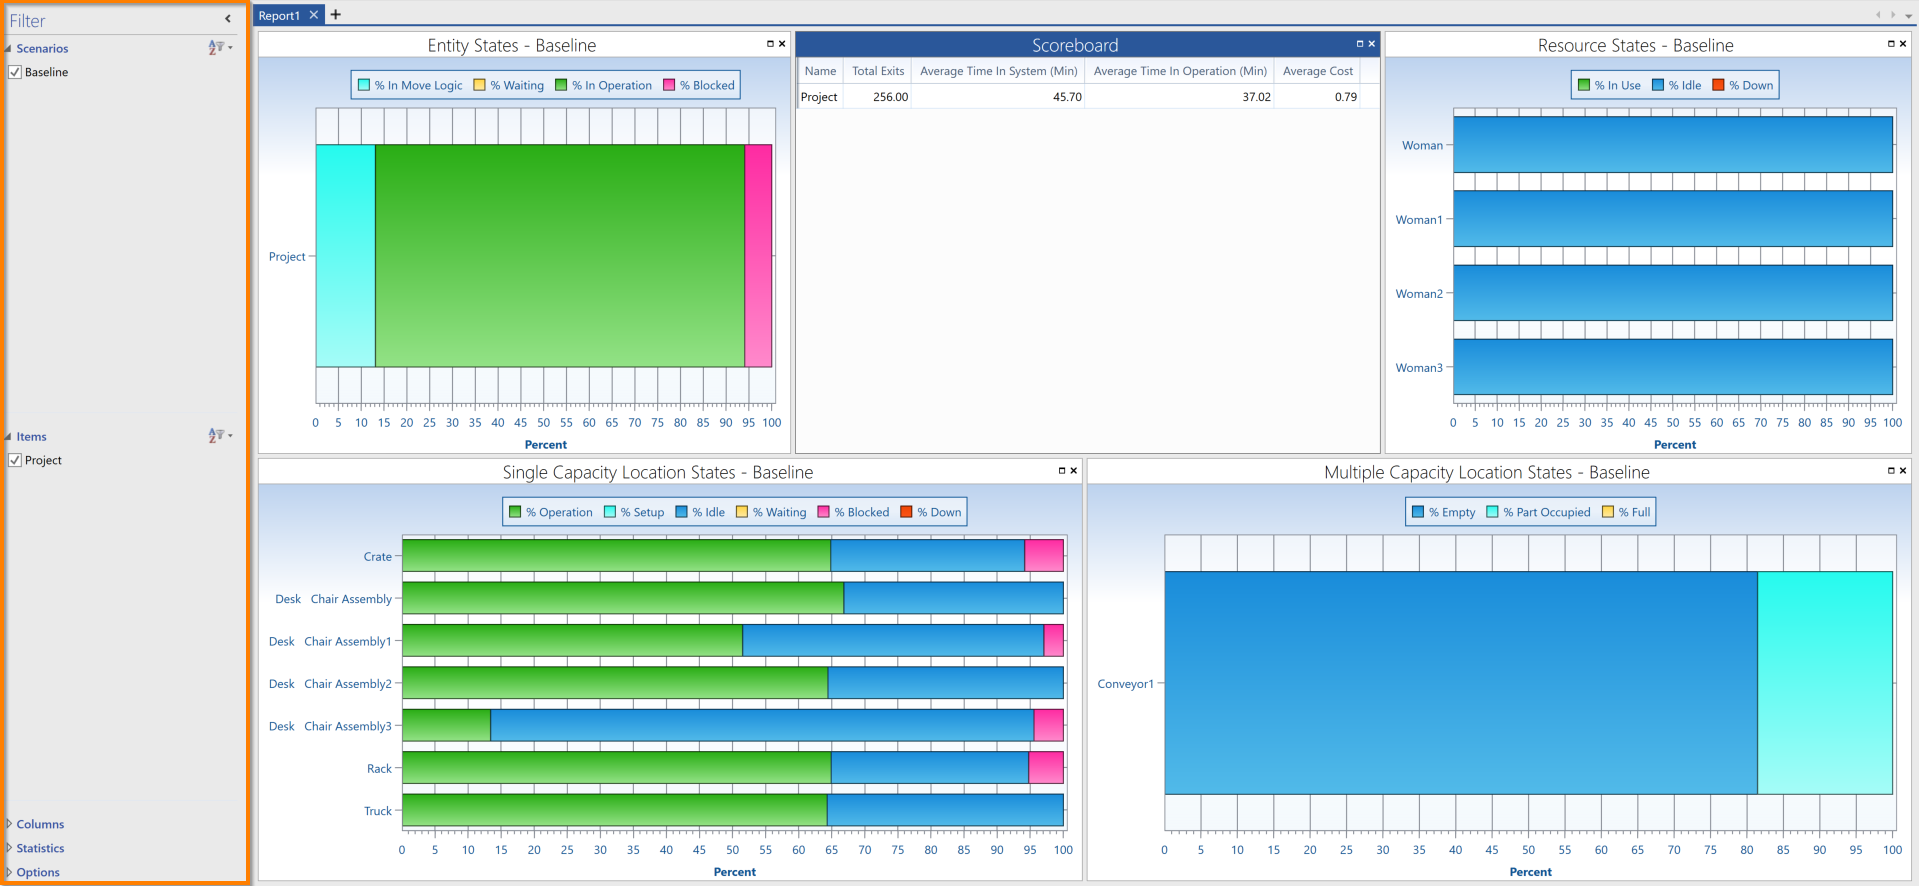
The Output Viewer Filter is used to determine what types of information and what items from your model are included in a table or chart. Select a report table or chart to view the filter information.
The Output Viewer Filter is also available when viewing an individual table or chart and includes a sections that vary based on the select table or chart type. Select a section to expand and display the information.
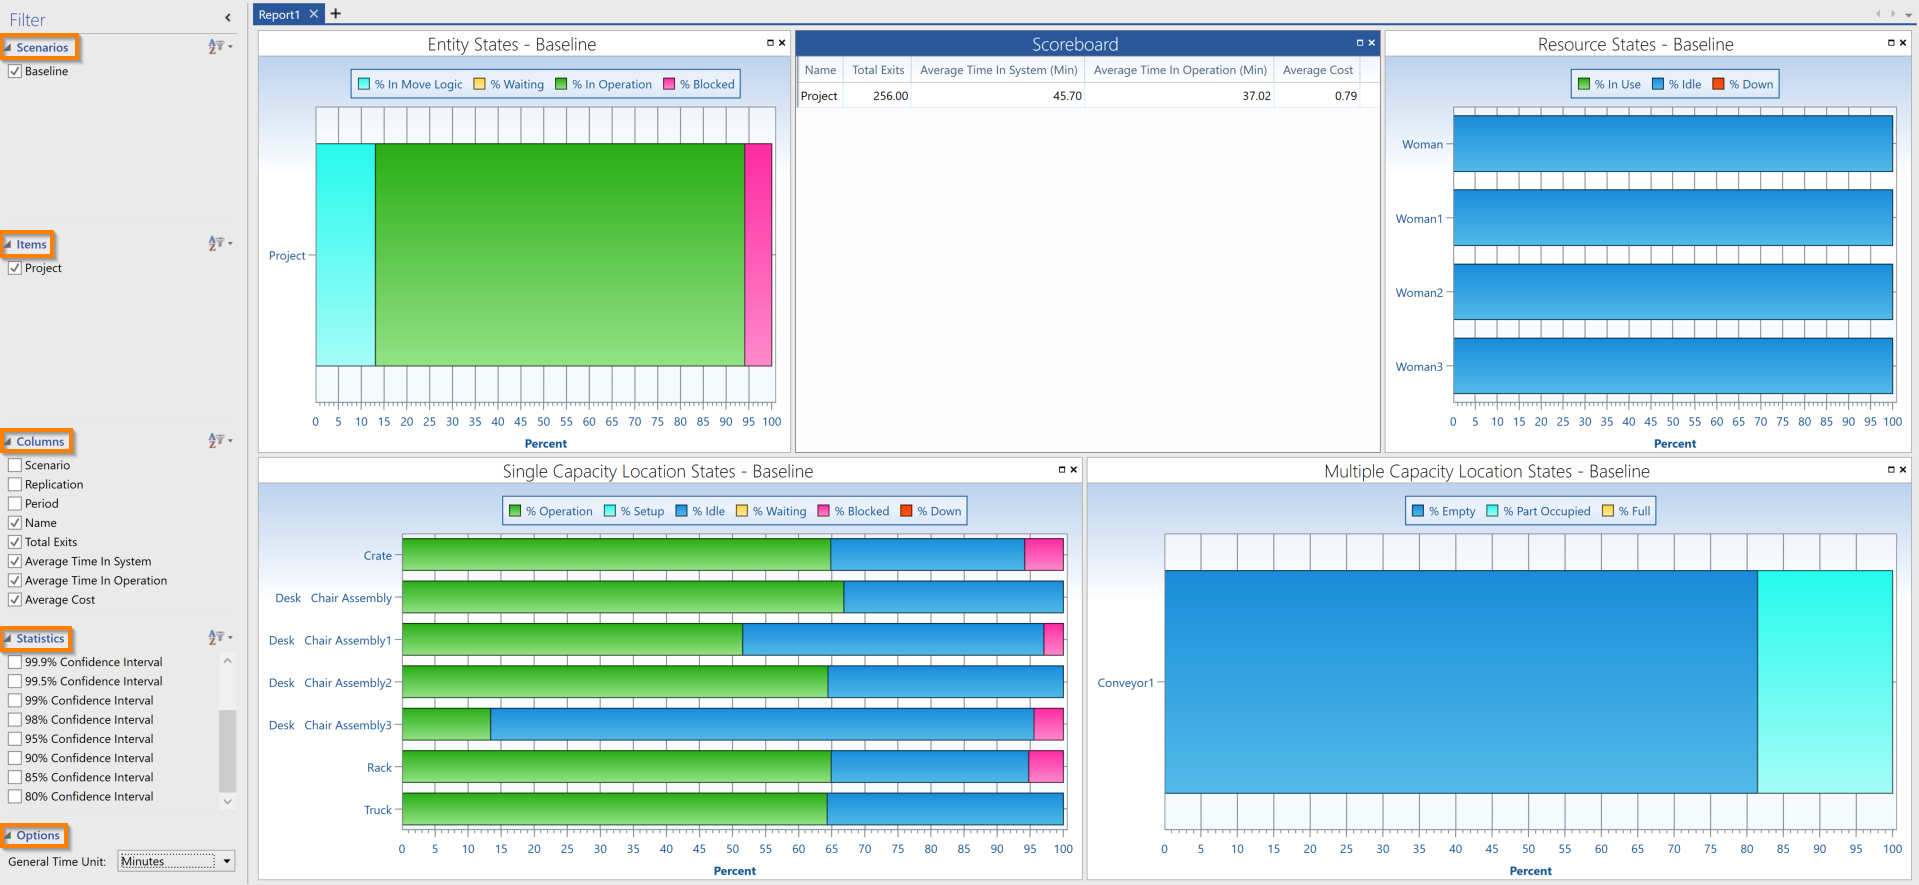
Each section includes model items, options for a table or chart, or statistical settings that you may select or clear to add or remove the item. The exception is the Options section, which contains different option menus depending on your selection.
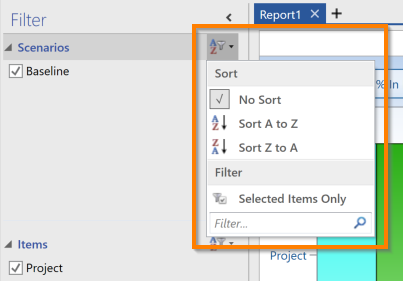
Use the sort icon to arrange the section items, or to filter items based on your input.
Report Tools
File
The File menu offers the following functions:
- New - Create a report and add tables and/or charts.
- Save - Store the report that you are currently working on. The file saves with the .pmov extension.
- Open - Bring a previous .pmov file into the Output Viewer.
- Data Sources - Add or remove Data Sources to and from a report.
- About - View information about Output Viewer, such as the version number.
- Exit Output Viewer - Close the Output Viewer.
Export
The following options are available to export different information about your simulation to your clipboard or Excel.
- Chart Data - Copy chart data to your clipboard.
- Picture - Add a picture of a chart onto your clipboard. To place an entire report picture onto your clipboard, select Report.
- Chart - Export data from a chart to Excel.
- To export data from a single report, select a report and go to Export > Chart Data > Report.
- To export data from all your reports, go to Export > Chart Data > All.
- Summary Data - Export raw summary data to Excel.
- Time Series Data - Export raw time series data to Excel.
Chart Tools, Table Tools, and Filter Tools
Which tools are available depends on whether you have a chart or a table selected. Select a chart to change the chart’s colors, type, layout and format using the Chart Tools section. Select a table to change the table’s format using the Table Tools section.